

 of iii.org
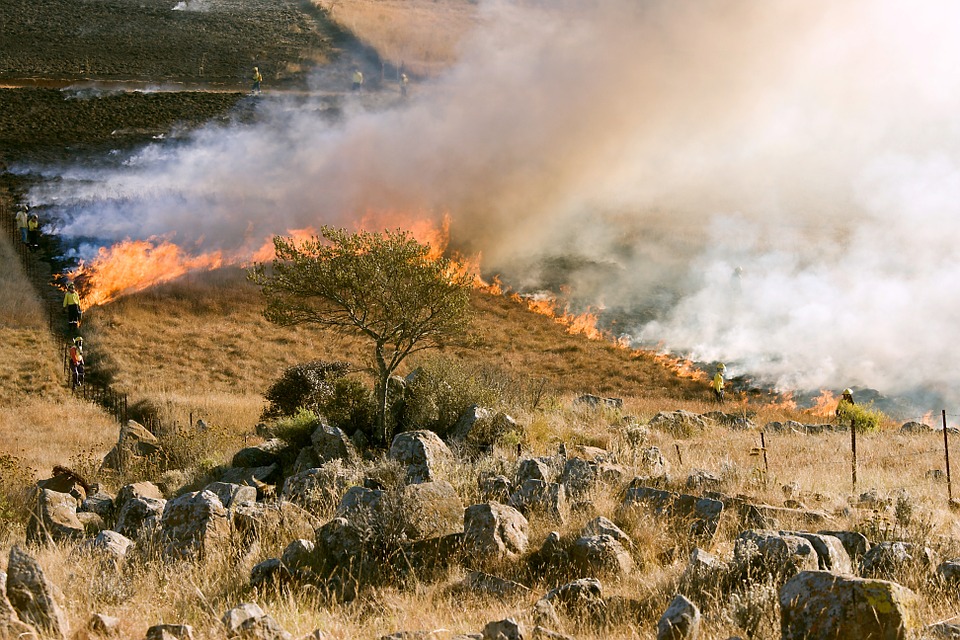
Fire plays an important role in the life of a forest, clearing away dead wood and undergrowth to make way for younger trees but the risk wildfires pose to people and property is growing as more people move into forested areas once largely uninhabited. These areas, known as the Wildland-Urban Interface (WUI), contain about 44 million houses in the lower 48 states, according to the U.S. Forest Service.
Rising temperatures are also believed to contribute to large, destructive blazes. Warmer weather contributes to wildfire conditions in several ways: dryer and more combustible vegetation, more frequent lightning strikes, an extended fire season; and more intense winds.
Harvard School of Engineering and Applied Sciences researchers have concluded that by 2050 the number of wildfires in the West could rise by 50 percent, and across the U.S. the number would double.
Damage caused by fire and smoke are covered under standard homeowners, renters and business owners insurance policies and under the comprehensive portion of an auto insurance policy. Water or other damage caused by fire fighters to extinguish the fire is also covered under these policies. In California, the California FAIR Plan covers residential and commercial properties located in brush and wildfire areas. Properties in those areas are subject to higher rates due to increased risk of fire.
As many as 90 percent of wildland fires in the United States are caused by humans, according to the U.S. Department of Interior. Some human-caused fires result from campfires left unattended, the burning of debris, negligently discarded cigarettes and intentional acts of arson. The remaining 10 percent are started by lightning or lava.
Wildfire prevention and mitigation
Researchers are discovering that embers blown by the wind during wildfires cause most of the fires that burn homes. Also, homes that are less than 15 feet apart are more likely to burn in clusters. In such cases, fire is often spread by combustible fences and decks connected to houses, a study by the Insurance Institute for Business & Home Safety (IBHS) found.
Among the preventive features recommended in the IBHS study were noncombustible siding, decking and roofing materials; covered vents; and fences not connected directly to the house. In addition, combustible structures in the yard such as playground equipment should be at least 30 feet away from the house and vegetation 100 feet away.
Properties at risk for wildfires
According to Verisks 2017 Wildfire Risk Analysis 4.5 million U.S. homes were identified at high or extreme risk of wildfire, with more than 2 million in California alone.
Total Potential Exposure To Wildfire Damage By Risk Category, 2014 (1)
($ billions)
|
(1) Reconstruction value of single-family residences at risk.
Source: CoreLogic, Inc., a data and analytics company.
Top 10 Most Wildfire Prone States, 2017
|
||||||||||||||||||||||||||||||||||||||||||||||||||||||||||||||||||||||||
(1) Number of households is based on data from the 2010 U.S. Census.
Source: Verisk Insurance Solutions Underwriting and Verisk Climate units of Verisk Analytics®.
Natural Catastrophe Losses In The United States, 2015 (1)
($ millions)
|
(1) As of February 2016.
(2) Events that have caused at least one fatality or losses of $3 million or more.
(3) Based on property losses including, if applicable, agricultural, offshore, marine, aviation and National Flood Insurance Program losses and may differ from data shown elsewhere.
Source: Munich Re NatCatSERVICE; Property Claim Services®, a unit of ISO®, a Verisk Analytics® business. © 2016 Munich Re, NatCatSERVICE.
Top 10 States For Wildfires Ranked By Number Of Fires And By Number Of Acres Burned, 2016
|
Source: National Interagency Fire Center.
Top 10 Costliest Wildland Fires In The United States (1)
($ millions)
|
(1) Property coverage only for catastrophic fires. Effective January 1, 1997, ISO’s Property Claim Services (PCS) unit defines catastrophes as events that cause more than $25 million in insured property damage and that affect a significant number of insureds and insurers. From 1982 to 1996, PCS used a $5 million threshold in defining catastrophes. Before 1982, PCS used a $1 million threshold. Does not include wildfires in 2017.
(2) Adjusted for inflation through 2016 by ISO using the GDP implicit price deflator.
Source: The Property Claim Services® (PCS®) unit of ISO®, a Verisk Analytics® company
